The multi-temporal coverage of the terminus from three different sources (topographic map, Landsat image and aerial photographs) is analyzed in this ArcGIS exercise. The glacier terminus is monitored over time by digitizing its location on top of the above mentioned data sources.
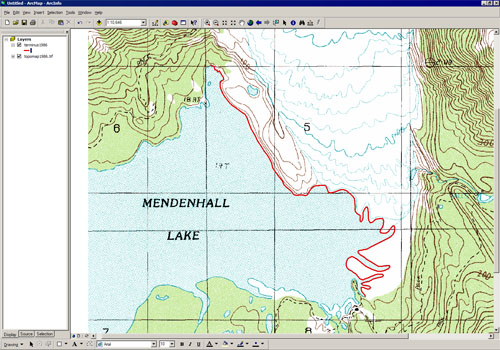
In order to digitize the terminus on the topographic map, a new shapefile needs to be created in ArcCatalog. Choose an appropriate name such as "Terminus 1986". The feature type is 'polyline'. For the digitized terminus boundary to correctly overlay on the topographic map the newly created shapefile has to be in the the same map projection and datum (UTM, zone 8, NAD27) as the topographic map. After loading the topographic map into ArcMap, we can now start editing a new feature in the shapefile. Choose a color for the terminus polyline (e.g. red) that stands out on the topographic map. The final result of this part of the exercise should look similar to the figure below.
 |
|
Location of Mendenhall Glacier terminus of 1986 determined from topographic map.
Data processed by Rudi Gens
|
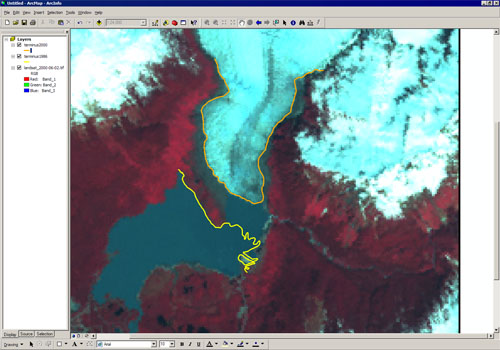
Displaying the terminus from 1986 on top of the Landsat image from 2000 clearly indicates the change that has occurred within the 14 years. The generation of a new shapefile and the digitization of the terminus for 2000 are performed the same way as described above. The result is shown in the figure below.
 |
|
Location of Mendenhall Glacier termini of 1986 (yellow) and 2000 (orange) displayed on a Landsat image.
Data processed by Rudi Gens
|
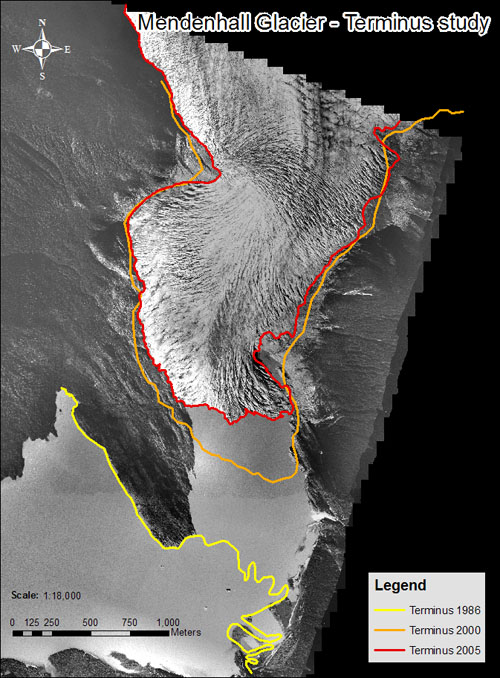
Then repeat the same process of terminus digitization using the aerial photo mosaic of 2005 as a backdrop image. Add also the termini shapefiles of 1986 and 2000 on the aerial photo mosaic to visualize changes in the terminus location between 1986 and 2005. Visualizing the older termini on the aerial photo mosaic shows a smaller change. However, considering that the time difference is just five years, the rate of change increased. After digitizing the terminus of 2005, we can generate a final map with the three termini overlaid on the aerial photo mosaic. In the final map (shown in the figure below) we add a title, a North arrow, a scale (1:18000 works fine for the size of our subsets) and a legend.
 |
|
Location of Mendenhall Glacier termini of 1986 (yellow), 2000 (orange) and 2005 (red) overlaid on an aerial photo mosaic.
Data processed by Rudi Gens
|